
| 일 | 월 | 화 | 수 | 목 | 금 | 토 |
|---|---|---|---|---|---|---|
| 1 | 2 | 3 | 4 | 5 | ||
| 6 | 7 | 8 | 9 | 10 | 11 | 12 |
| 13 | 14 | 15 | 16 | 17 | 18 | 19 |
| 20 | 21 | 22 | 23 | 24 | 25 | 26 |
| 27 | 28 | 29 | 30 |
- np.triu
- 주식
- 대학생재테크
- R
- 오블완
- 넘파이 매서드
- Tutorial
- singe cell ran sequencing
- np.diagflat
- np.trace
- 주식투자
- endothelial
- np.flatten
- 대학생주식
- liver
- Python
- 대학원
- single cell rna sequening
- scanpy
- journal meeting
- single cell rna sequencing
- numpy
- 티스토리챌린지
- 후기
- 통계학
- 선형대수
- bioinformatics
- pcrnaseq
- scRNASeq
- Preprocessing
- Today
- Total
biotechknowledge
[Journal review]Tutorial: guidelines for the computational analysis of single-cell RNA sequencing data 본문
[Journal review]Tutorial: guidelines for the computational analysis of single-cell RNA sequencing data
준2준2 2024. 11. 27. 20:32
혼자서 scRNAseq 공부하고 figure를 만드려하니 어려움이 있다. 대충 어떤실험인지 알겠으나 어떻게 해야할지 쉽게 풀리지 않는다. tutorial 과 reference 최대한 다양하게 접하고 내가 갖고 있는 데이터에 적용시키려고 한다. nature 급 저널에서 소개하는 workflow를 읽어보고 부족했던 부분을 채워보려한다. 물론 이 논문한권으로 빈틈이 다 메꿔질거라 기대하지 않는다.
Introduction
scRNAseq 은 크게 2가지 task로 진행한다. 1) generation of the expression matrix 2) analyses of the expression matrix. 1번은 cellranger, 2번은 scanpy로 분석하는 단계를 말하는 것 같다. 이 논문에서는 2단계를 설명하고 있다.
주요 실험 방식:
- 고수율(low-depth, high-throughput): 세포당 감지하는 RNA(depth)가 적음.
- 많은 세포를 미세 유체 기반 드롭릿(droplet)이나 웰(well)로 분리하고 얕게 시퀀싱.
- 세포별 바코드와 **UMI(Unique Molecular Identifiers)**를 사용해 중복 제거 및 발현 수준 정확도 향상.
- 단점: mRNA의 3' 또는 5' 말단만 시퀀싱 가능.
- 대표 플랫폼: 10× Chromium.
- 저수율(high-depth, low-throughput): 세포당 감지하는 RNA(depth)가 많음)
- 소수의 세포를 개별 웰에 분리하고 깊게 시퀀싱.
- Smart-seq2 프로토콜 사용.
- 장점: 전체 전사체 분석 가능, 높은 민감도.
- 단점: UMIs 미지원(최근 Smart-seq3는 지원)
takeaway : smart-seq, depth, throughput
논문에서 소개하는 hands-on tutorial 사이트, 논문 다 읽고 따라해보자.
https://www.singlecellcourse.org/
Analysis of single cell RNA-seq data
In this course we will be surveying the existing problems as well as the available computational and statistical frameworks available for the analysis of scRNA-seq. The course is taught through the University of Cambridge Bioinformatics training unit, but
www.singlecellcourse.org
- combine Data from Multiple Experiments
데이터가 여러개인경우 합쳐서 하나의 큰 Matrix를 만든다. 데이터를 합칠 때 depth, cell cycle, batch 등 을 보정한다. - Visualize the Data
시각화 해보며 threshold 를 조절해본다. 원하는 그림이 나올때까지 - Identify Pattens
Clustering, Pseudotime Analysis, Differential Ecpression Analysis
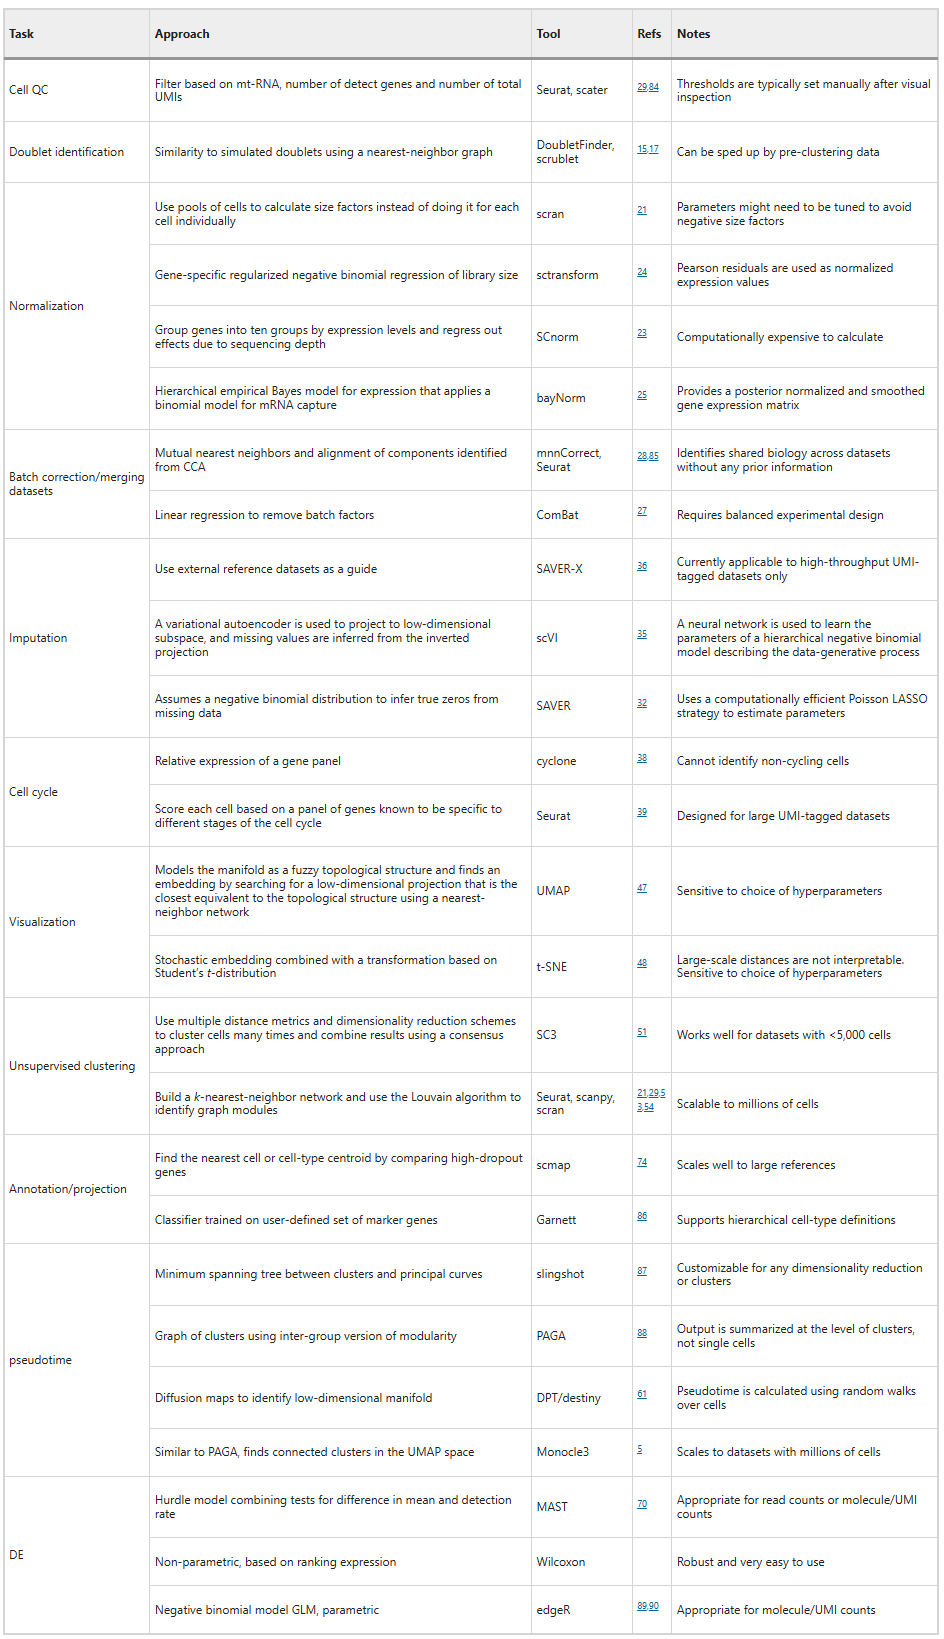
Quality control
- background effect 제거
Thresholding: Set a minimum number of RNA molecules (UMIs) required for a barcode to be considered a cell. Barcodes below this threshold are ignored - 손상된 세포 제거하기
Number of detected genes, Mitochondrial RNA proportion, Unmapped or multi-mapped reads - Doublets cell 제거하기
Doublets: One barcode might tag multiple cells (~5% of cases). This leads to mixed gene expression profiles.
Nomalization
세포마다 뱔현되는 RNA양이 다르게 때문에, 서로 비교가능하게끔 정규화가 필요함. (depth를 맞춘다.)
세포타입마다 유전자발현양상이 다르기 떄문에 세포타입을 비교하는 것이 목적이다.
Batch effect correction
Batch effect를 보정하기 위해서 각 배치별로 2개의 샘플(condition)을 두어야 보정이 적절히 이루어진다.
Imputation and smoothing
missing value 채워 넣음. (sclmpute, Drlmpute, SAVER)
Cell cycle assignment
cell cycle 중 DNA 복제되는 시기에 전체적으로 gene expresison 이 늘어난 상황으로 G1 phase 와 비교하기 위해서 보정해야한다.
Feature selection
tool 이용 Highly Variable Genes (HVGs)
Dimensionality reduction and visualization
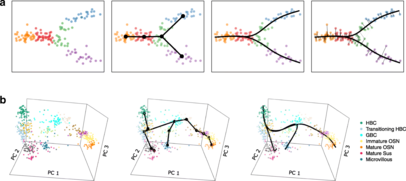
Pseudotime
stem cell 과 같이 developmental processes 가 있는 경우 Pseudotime 그래프를 그려볼 수 있다.
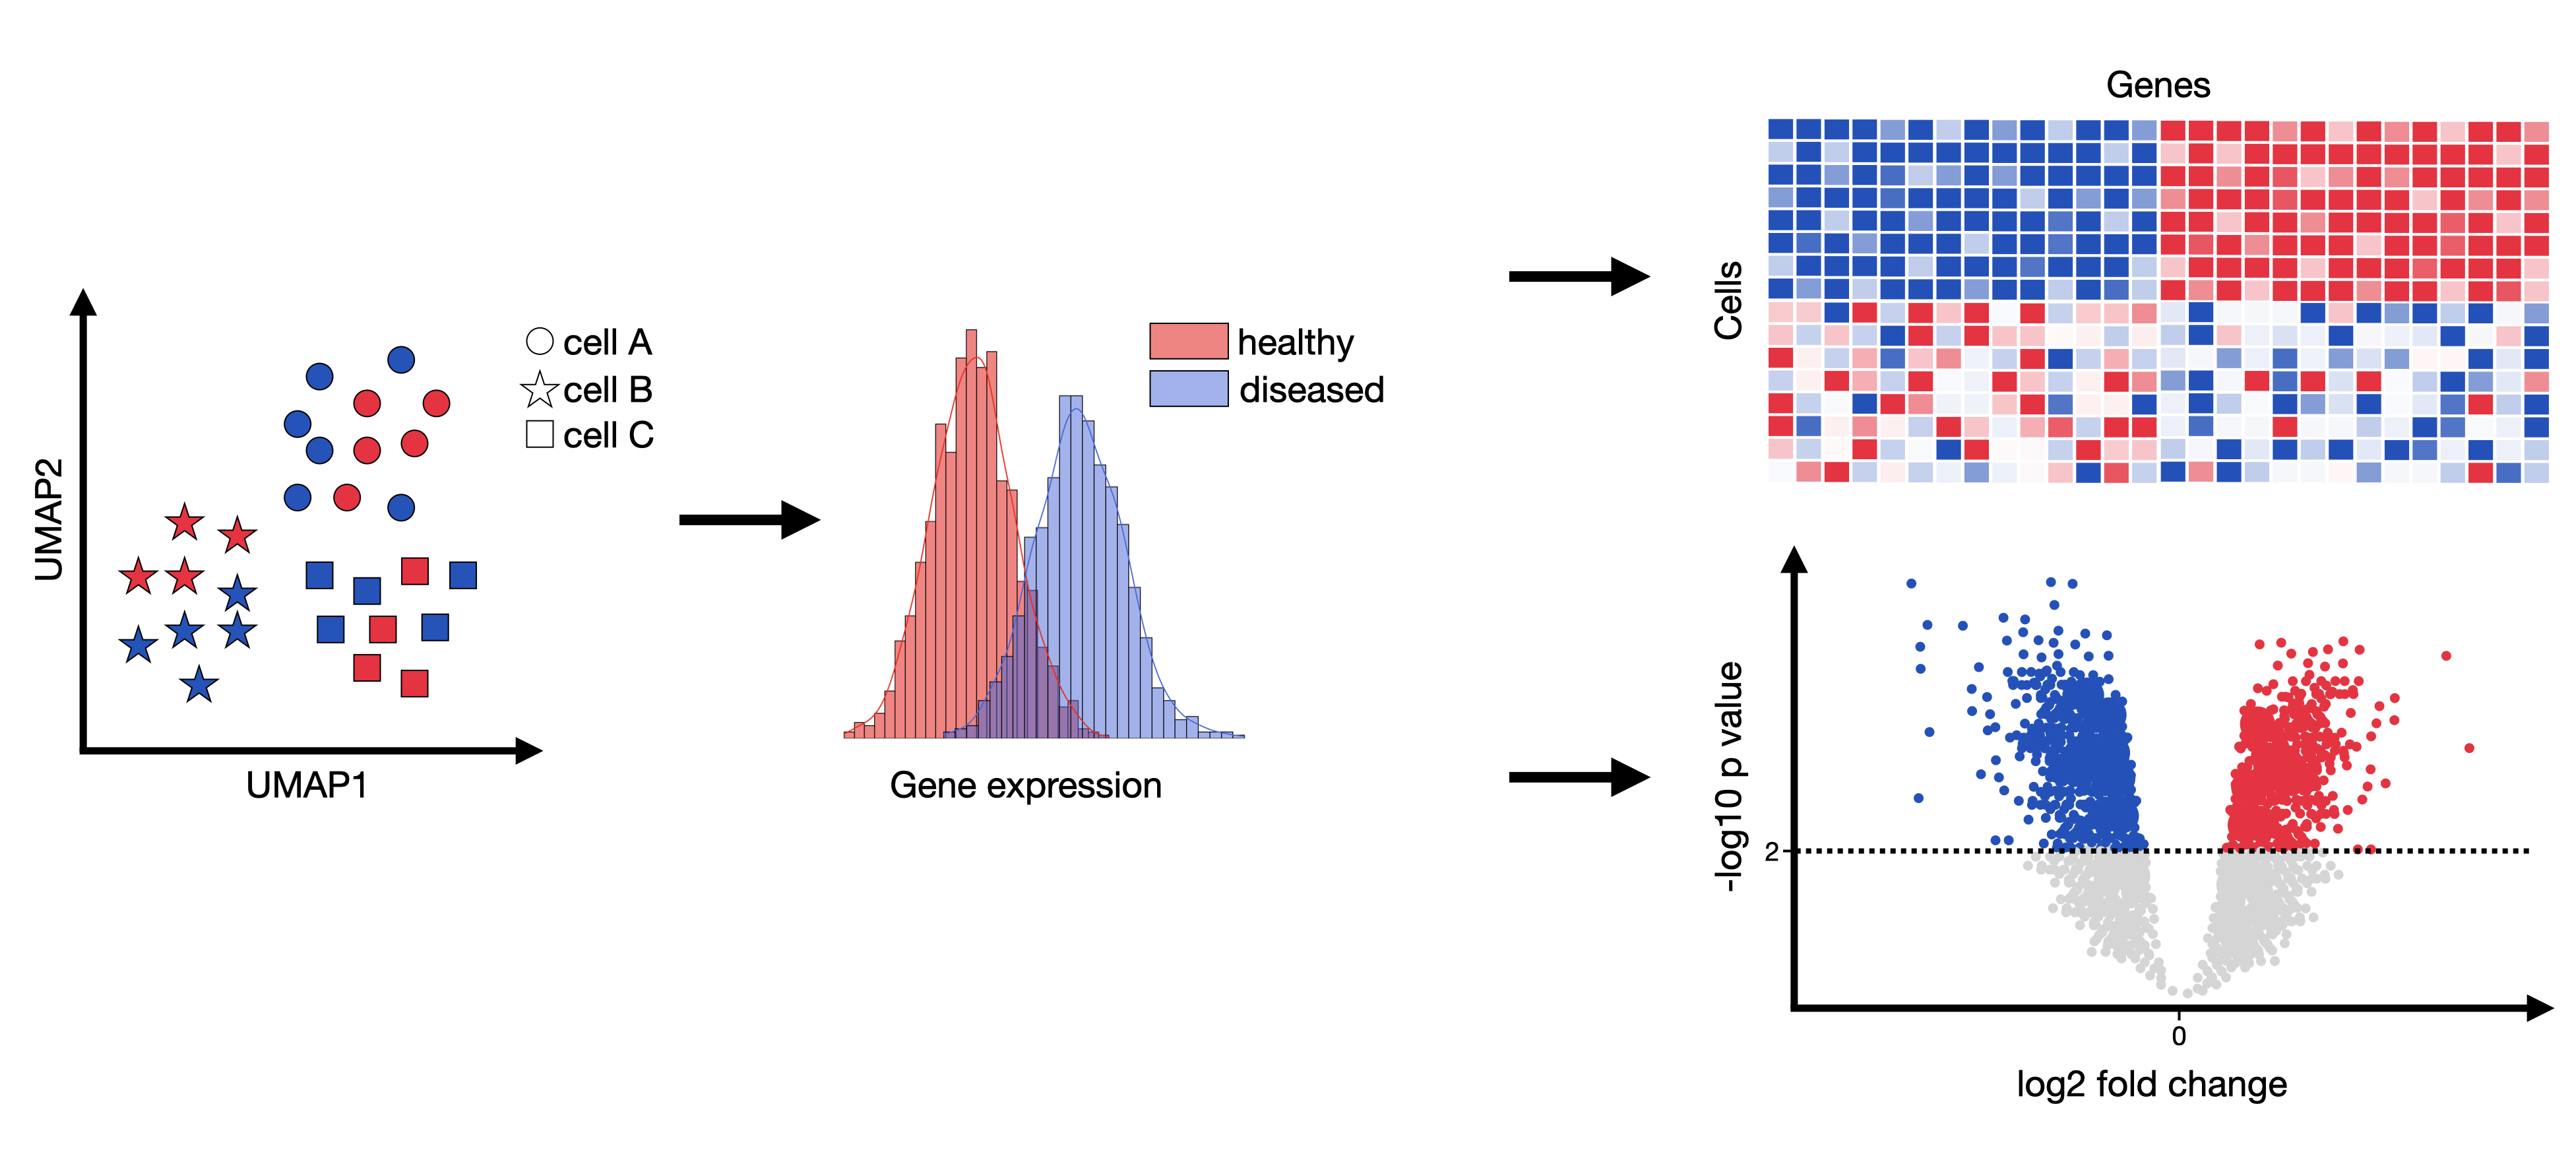
Differential expression
Comparing versus combining datasets
2024.11.27
논문에서는 개괄적인 내용을 설명하는 부분이 대부분이었다. 갖고 있는데이터를 가지고 비슷하게 filtering 해봤는데 cell 수가 너무 줄어든다. 8천개로 시작해서 3800개 밖에 안남았는데 이걸로 clustering 해보니까 안 이쁘게 나눠진다. 필터링은 마지막에 fine tunning 할때 조절해보는걸로하고 처음에는 rough 하게 하고 지금 막힌 부분인 annotation 을 집중적으로 찾아볼 예정이다.

